
Quiz Statistics Report
The quiz statistics report gives instructors and admins the headline numbers for a quiz: how many times it has been taken, the average score, and the pass rate. It also answers the question those three numbers always raise next - which question is everyone getting wrong.
What you can do
- See how many times each quiz has been taken, right in the Quizzes list.
- Read a quiz's pass rate to judge whether it is too easy or too hard, without confusing it with the passing score you configured.
- Find the hardest question in a quiz on a screen, with Learnomy Pro, instead of reading it out of an API response.
- Read the same figures from the command line with WP-CLI when you are working on the server.
- Pull the numbers over the REST API to feed your own dashboard or an AI assistant.
How to use it
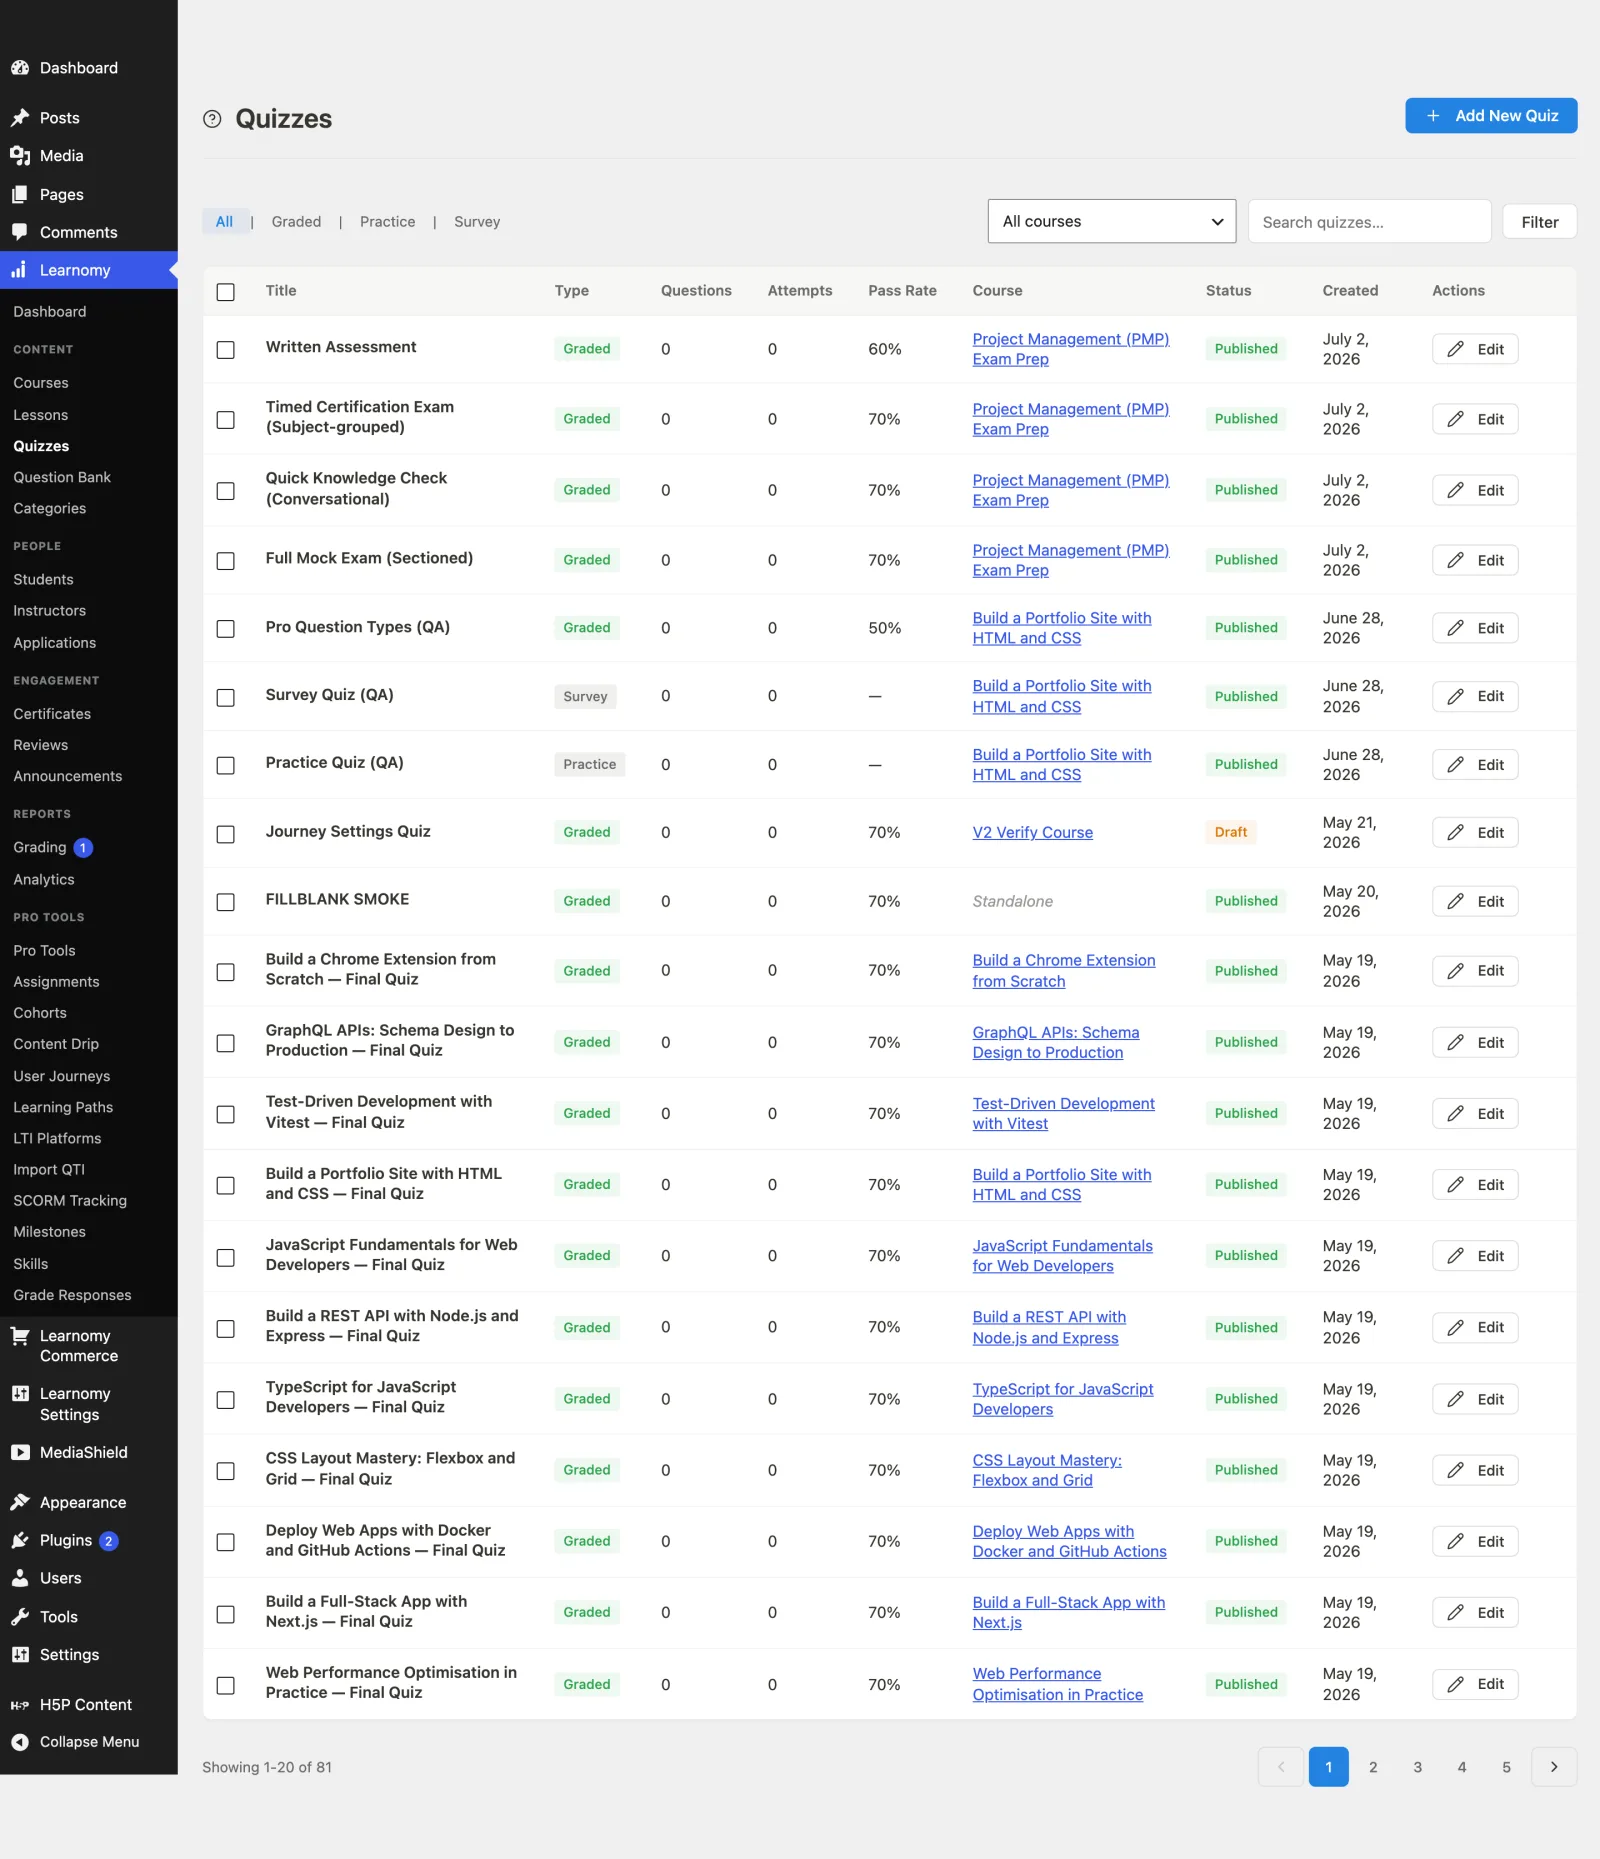
Go to Learnomy > Quizzes. The list table shows one row per quiz with its Attempts count and its computed Pass Rate (the share of graded attempts that passed - not the configured passing score threshold). A quiz that has attempts but nothing graded yet shows a dash under Pass Rate, because "nobody has been graded" is not "everybody failed".
Let students take and finish the quiz. Pass rate and average score are built only from attempts that have been graded, so an in-progress or ungraded (for example essay-pending) attempt does not move them yet.
To find your hardest questions with Learnomy Pro, open Instructor Reports at
/instructor/reports/, click the course, and read the Quiz performance section at the bottom of the page. It lists each quiz in the course with its attempts, its pass rate, and the single hardest question with the share of learners who answered it correctly. Click that question to see which answer people are actually picking. See Instructor Reports for the full walkthrough.Without Pro, or when you are already on the server, run
wp learnomy inspect quiz <id>. It prints the same figures - attempts, pass rate, average score, and every question ordered hardest first - in the terminal.To feed the numbers into something else, use the REST endpoints under For developers below.
Who can see these numbers
- Administrators see quiz statistics for every quiz on the site.
- Instructors see the statistics for a quiz on a course they are the main author of, or are the primary instructor on. This is wider than it was: the per-quiz analytics used to be an administrator-only read, so an instructor got a permission error on the numbers for their own course.
- A quiz on someone else's course is refused, and so is a logged-out visitor.
- Co-instructors are refused, and this is worth knowing because it does not line up with the reports. Instructor Reports scopes by author OR co-instructor, so a co-instructor can open the course report but is refused that course's quiz statistics. If a co-instructor needs the numbers, make them the primary instructor on the course.
- Students never see any of this. Their own score, and any per-question feedback, is governed by the quiz's feedback timing setting instead.
Settings & options
There is nothing to switch on. The report is read-only and is computed live from quiz attempts, so it is always available once a quiz has attempts.
What the numbers mean and where they come from:
- Attempts (Quizzes list) - every attempt started on the quiz, whatever its state. It answers "has anyone sat this", so an in-progress or ungraded attempt is included.
- Pass rate - the share of graded attempts that passed, as a percentage, shown as a dash while no attempt is graded. An attempt passes when its score meets the quiz's Passing score (
passing_scoreon the quiz), so changing the passing score changes the pass rate. It is counted per attempt, not per student: a student who sat the quiz three times counts three times. - Average score - the average of each graded attempt's
percentage, rounded to two decimals. In-progress and ungraded attempts are excluded. - Hardest question / facility - the share of responses to that question that were fully correct. Lower means harder. It is computed over graded and submitted attempts, and the question with the lowest share in a quiz is the one Pro surfaces as the hardest.
- Answer distribution - for a multiple-choice question, how many people chose each option and what share of responses that is, most-chosen first. When a wrong option out-draws the correct one, it is called out. Open-ended questions (essay and similar) have no fixed options to tally, so they show a note instead of a table.
- Discrimination - a point-biserial value available over the REST API. It only appears once a question has 10 or more graded responses, below which it is not statistically meaningful.
For developers
- Quiz statistics:
GET /learnomy/v1/quizzes/{id}/statistics. Returnsquiz_id,attempt_count,avg_score, andpass_rate, all overstatus = 'graded'attempts only - soattempt_counthere is the graded subset, not the Attempts column in the Quizzes list. Permitted for an administrator or an instructor of the quiz's course. - The quiz numbers are computed in
QuizAttempt::get_statistics( $quiz_id ), a single aggregate query over the attempts table. The Quizzes list column usesQuizAttempt::pass_stats_for_quizzes()instead, one grouped query for the whole page, which returnstotal_attempts(all states),graded,passed, andpass_rate. - Per-question statistics:
GET /learnomy/v1/questions/{id}/statistics. Returnsquestion_id,times_answered,avg_score_pct, anddiscrimination(null until 10+ responses). The per-question numbers are computed inQuestionResponse::get_statistics( $question_id ); the discrimination value is calculated in the questions controller'scalculate_discrimination(). - Pro per-quiz analytics:
GET /learnomy-pro/v1/analytics/quizzes/{id}returns attempts, pass rate, average score, average time, and per-question facility. Its permission callback admits thelearnomy_view_advanced_analyticscapability (administrators) or an instructor whose course the quiz belongs to, resolved through the same course scope Instructor Reports uses. Anyone else gets a 403. - The same data is exposed as an ability,
learnomy/get-quiz-analytics(categorylearnomy-reporting), described as per-quiz attempt/pass statistics plus per-question difficulty. It takes aquiz_idand is permission-checked against manage access on the quiz's course. - WP-CLI:
wp learnomy inspect quiz <id>prints attempts, pass rate, average score, and per-question facility ordered hardest first. Supports--format=table|json|yaml.