Analytics Dashboard
Pro feature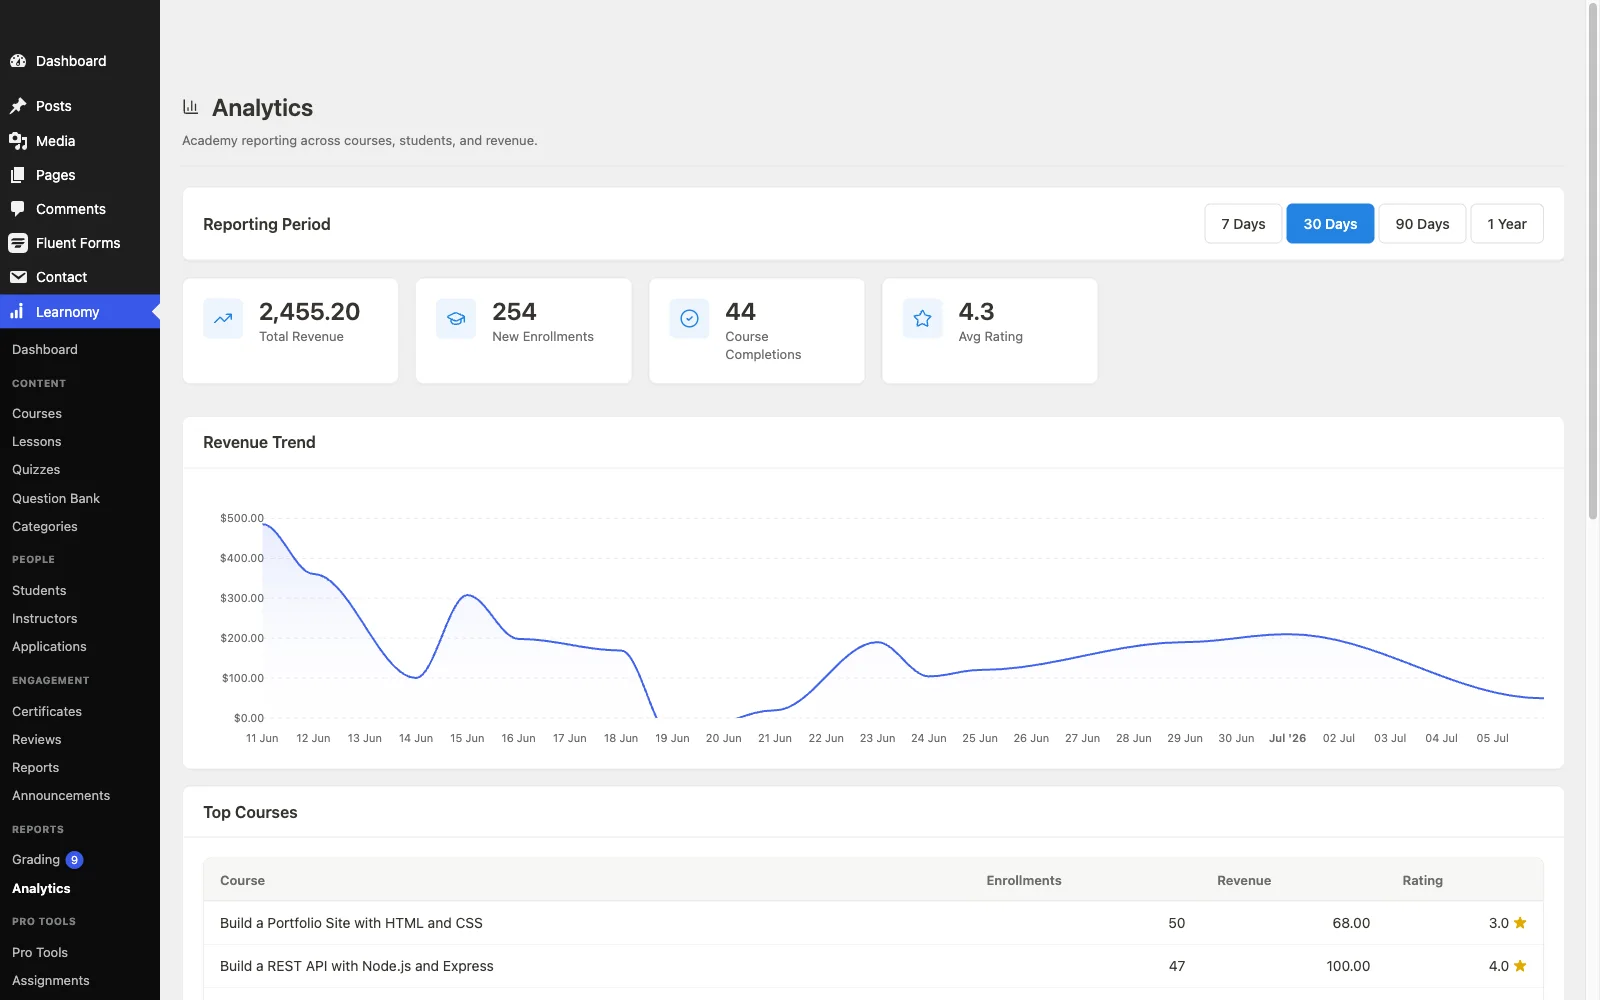
🔶 Pro feature. Available in Learnomy Pro.
The Analytics dashboard gives you a site-wide view of revenue, enrollment activity, course completions, and top-performing courses and instructors, for any reporting period you choose.
Overview
The Analytics dashboard is at Learnomy > Analytics in the admin sidebar. It is only visible when the Analytics extension is active in Learnomy Pro.
Choosing a Reporting Period
Go to Learnomy > Analytics in the admin sidebar.
At the top of the page, click one of the four period buttons to change the reporting window.

Period What it covers 7 Days The last 7 days 30 Days The last 30 days (default) 90 Days The last 3 months 1 Year The last 12 months The page reloads with data for the selected window. A screen-reader announcement confirms which period is now active.
KPI Cards
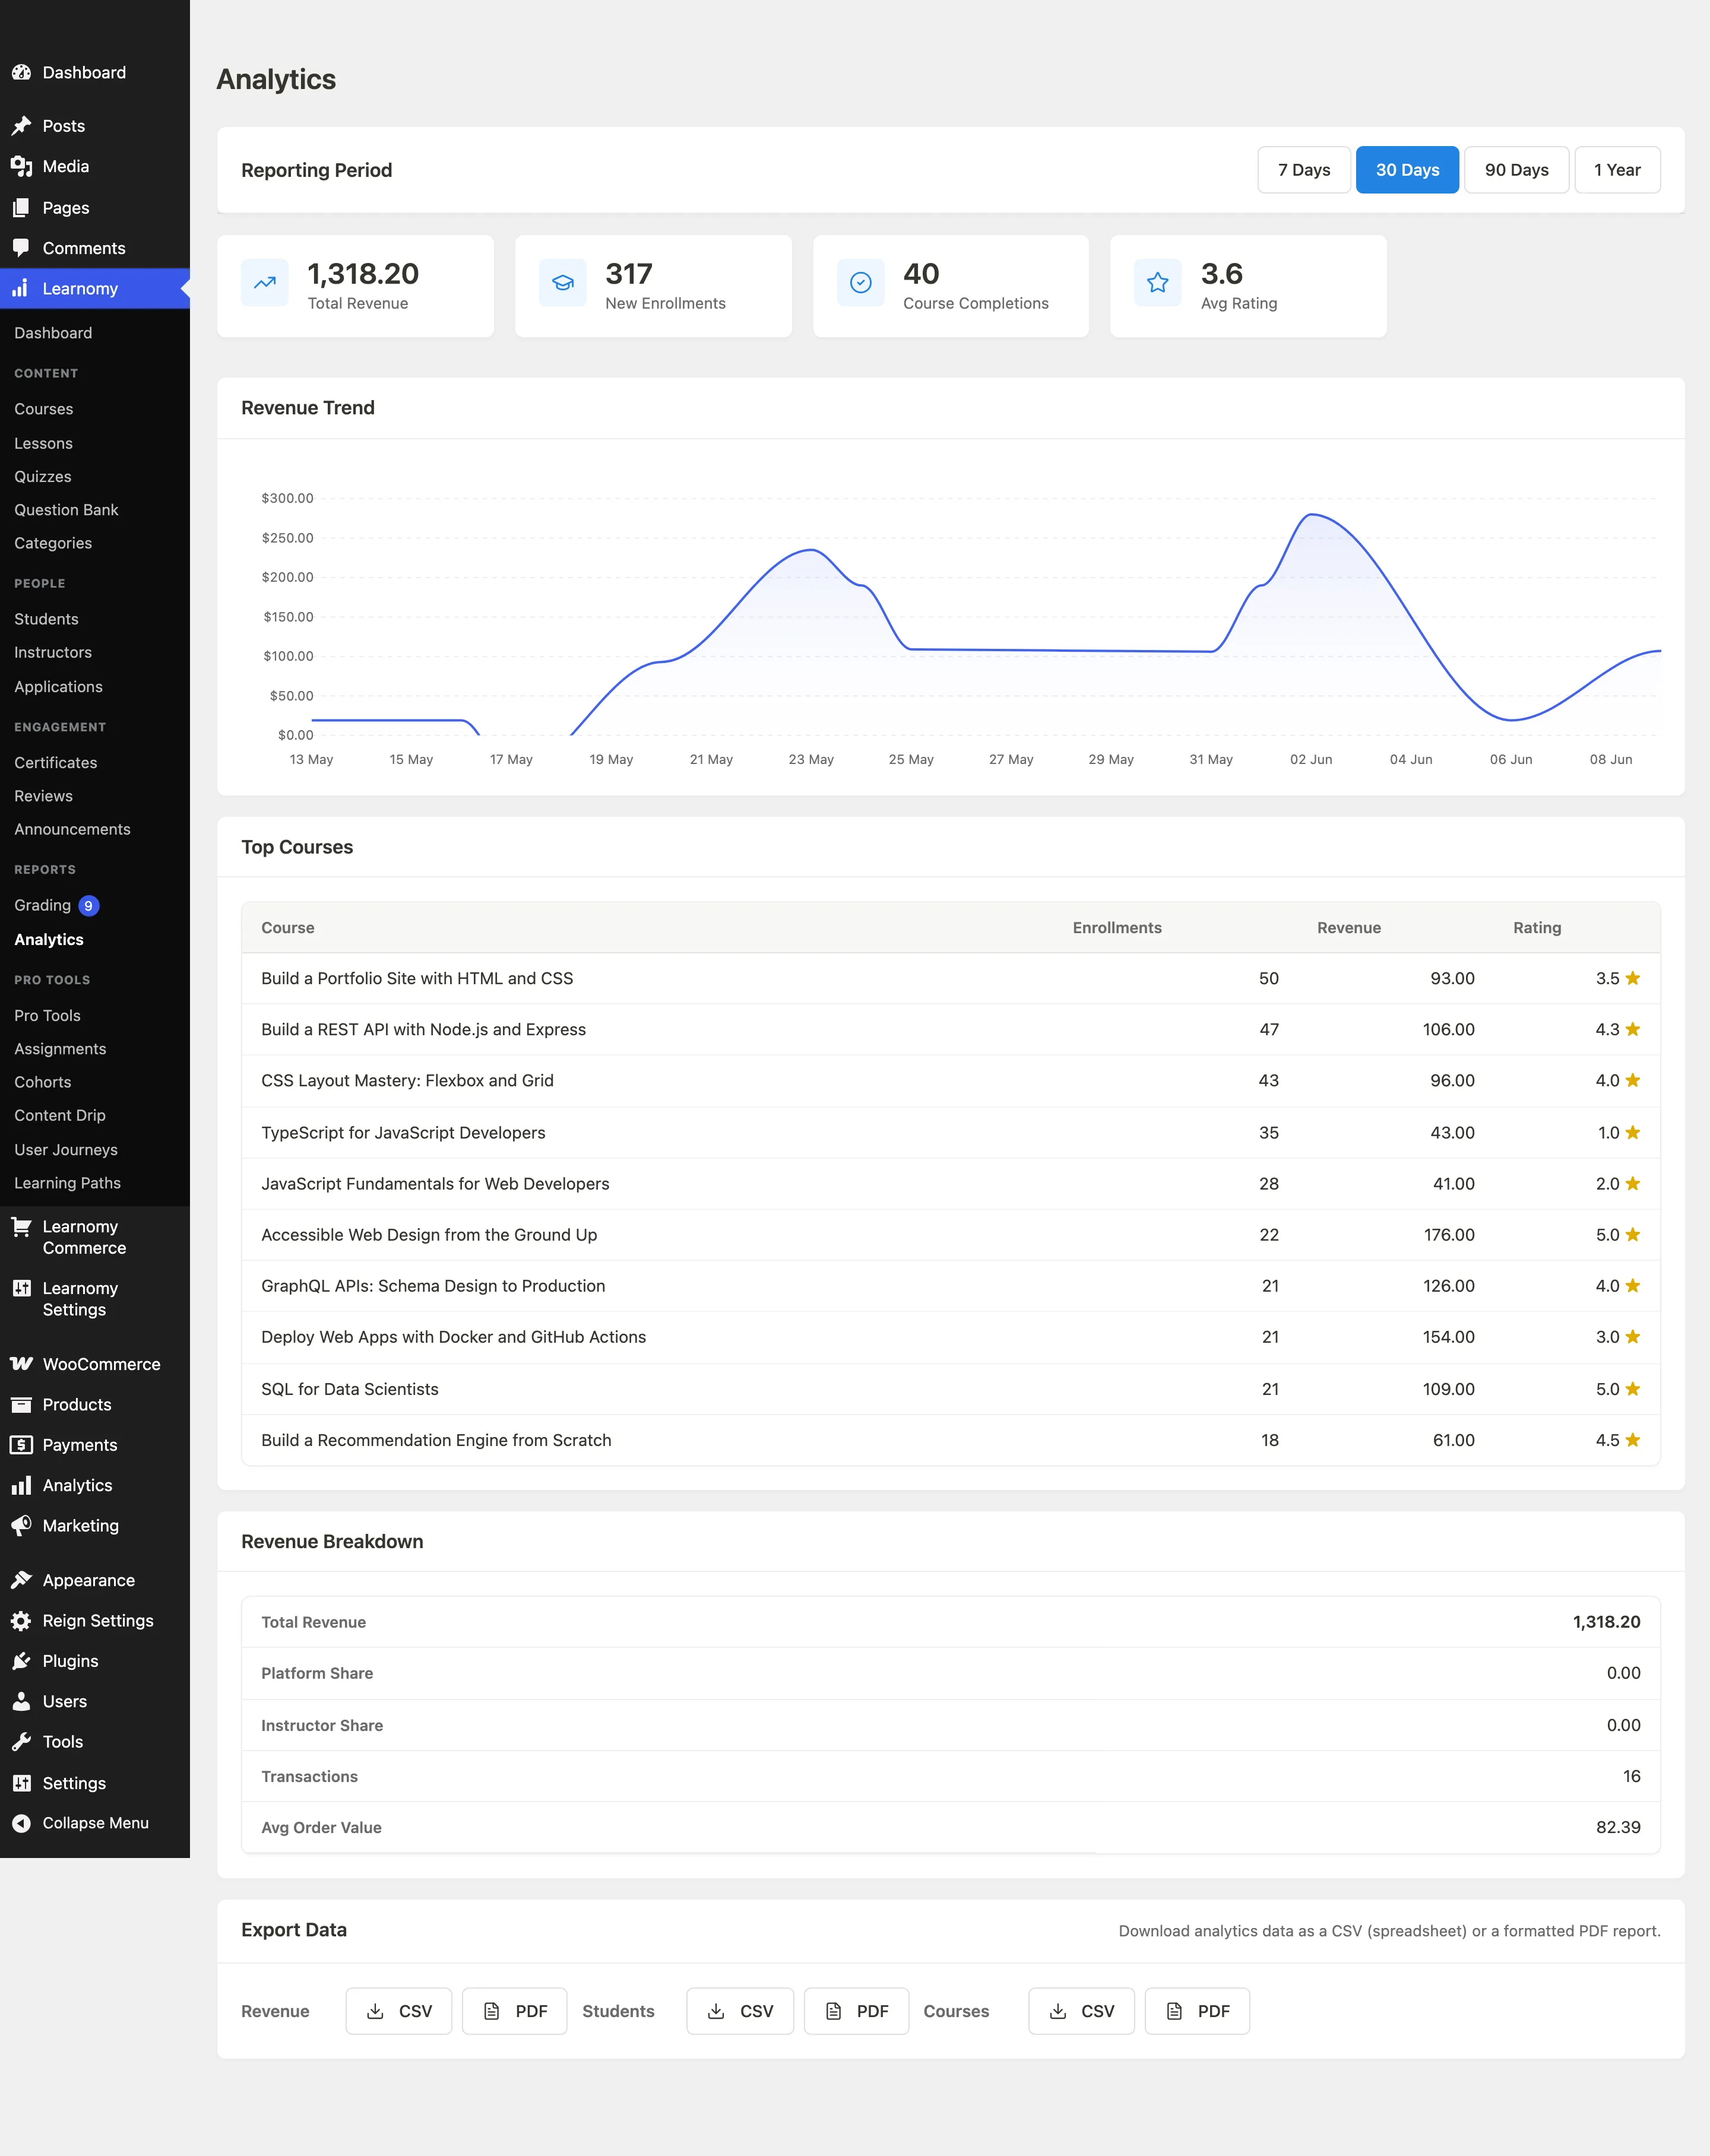
The four stat cards at the top of the dashboard show headline numbers for the selected period.
| Card | What it shows |
|---|---|
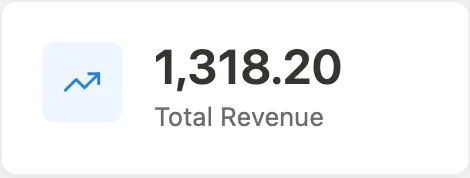
| Total Revenue | Sum of all completed transactions in the period |
| New Enrollments | Number of new course enrollments in the period |
| Course Completions | Number of courses marked complete by students in the period |
| Avg Rating | Average star rating across your top courses |
Revenue Trend
The Revenue Trend section shows an area chart of revenue over time for the selected period.

Each point represents a day or week depending on the period length. Hover over a point to see the exact revenue amount for that interval. If there is no revenue in the period, the section shows an empty state message instead of a blank chart.
An accessible data table is included for screen reader users.
Top Courses
The Top Courses table lists your highest-earning or most-enrolled courses for the period.
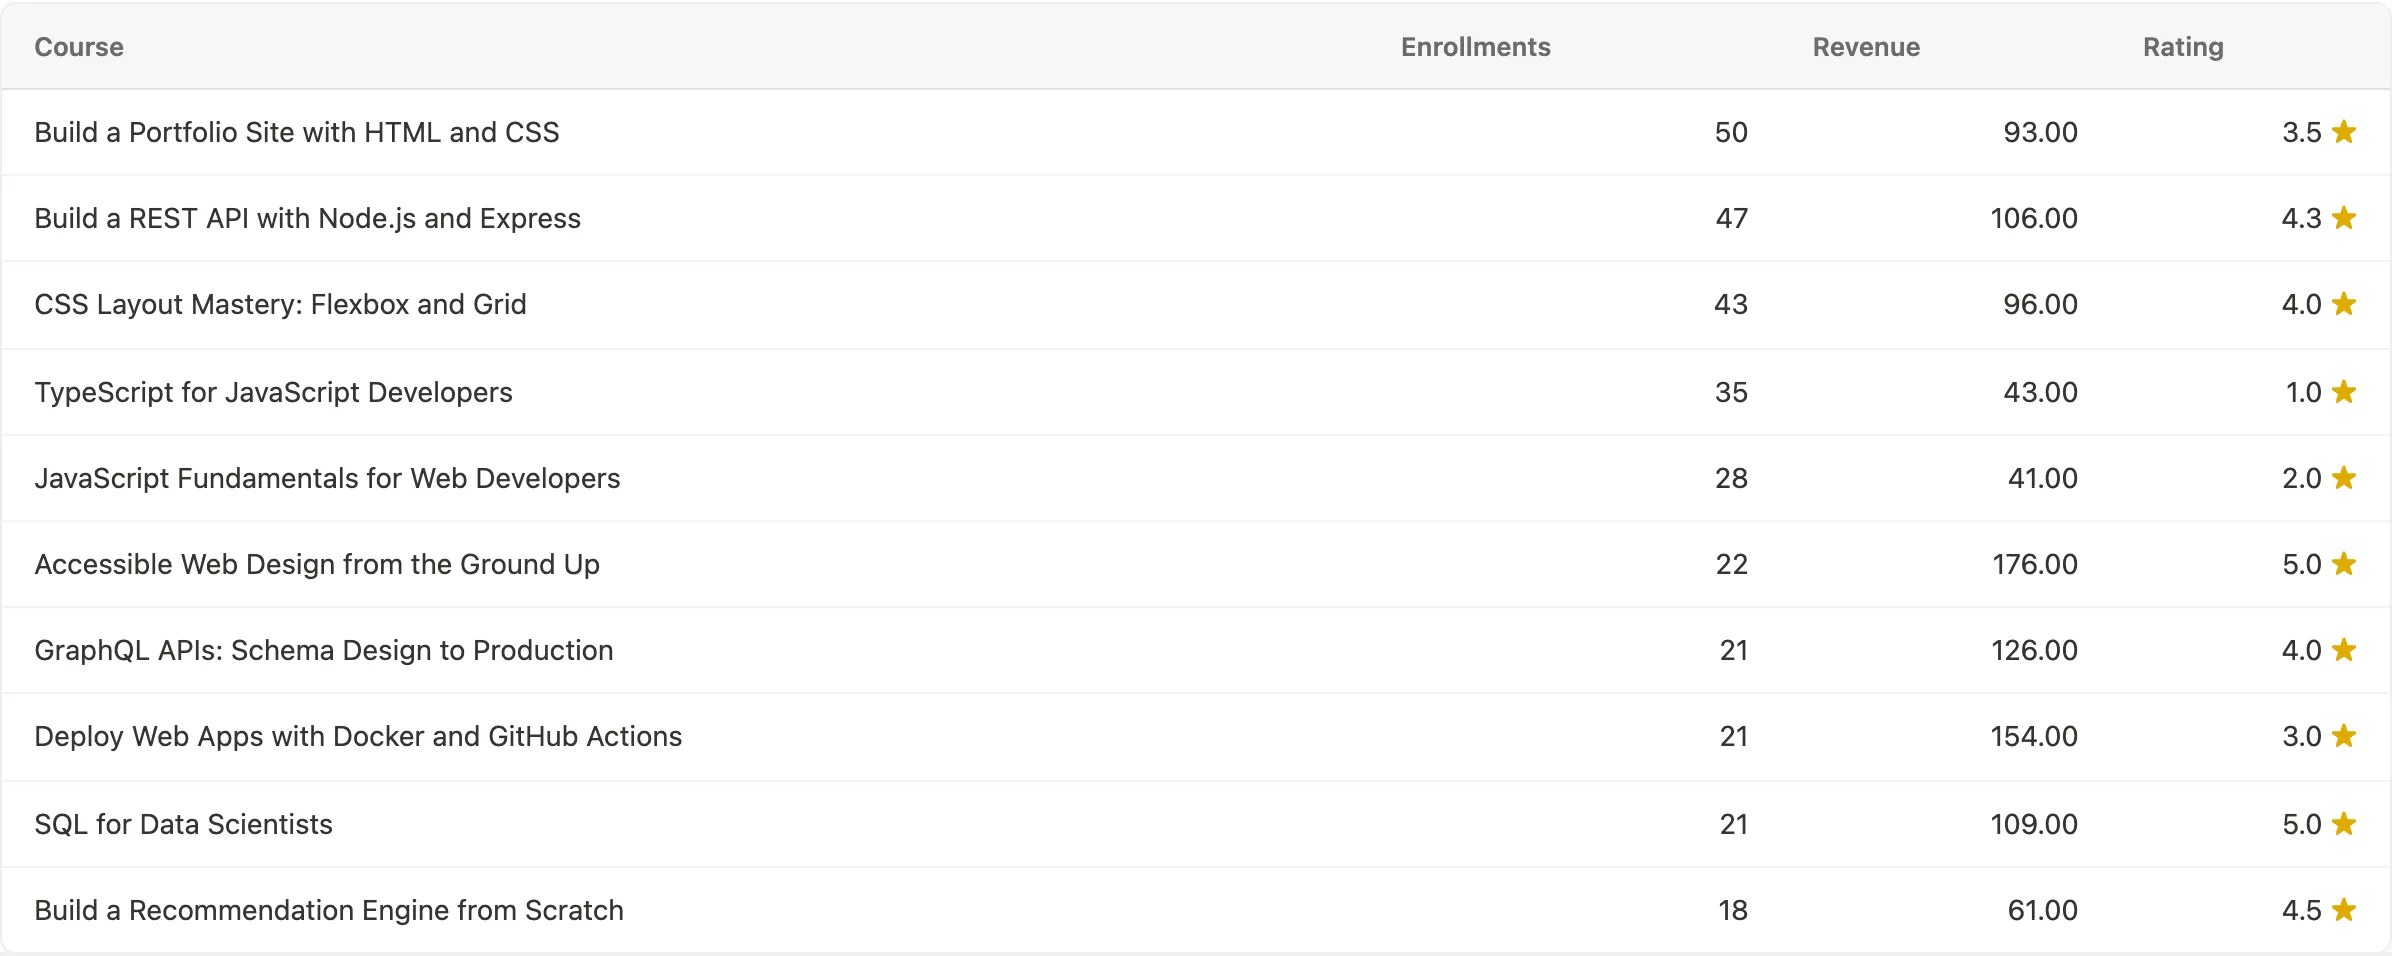
Each row shows the course title, enrollment count, completion count, average rating, and revenue. Use this to identify which courses are driving growth and which may need attention.
Assignment activity
When the Assignments extension is active, the analytics engine also reports per-assignment submissions, graded count, average score, and late count (GET /analytics/assignments and /analytics/assignments/{id}). The same numbers appear in the instructor Reports Assignments section and in the shared CSV / PDF export. One grouped query per course — no N+1.
Exporting Analytics Data
Click Export CSV in the Export Data section at the bottom of the dashboard to download the current dashboard data as a CSV file.

The export covers the currently selected reporting period. Open it in any spreadsheet application. The download streams directly without a separate confirmation step.
Tips
- Revenue figures show completed transactions only. Refunded transactions are not included in the totals.
- The Average Rating in the KPI cards is calculated from the courses that appear in the Top Courses list for the period, not all courses site-wide.
- Instructor-level analytics (earnings per instructor, top instructors by revenue) are available in the same view when the Commissions module is active. Look for additional columns in the Top Courses table.
- When the page first loads with no data (a new site or a period with no activity), each KPI card shows zero and the Revenue Trend shows an empty state. This is expected.