Admin Dashboard
Free & ProThe admin Dashboard is the landing page for Learnomy in wp-admin. It shows academy-wide stats, trend charts, and a summary of recent activity so you can see what is happening at a glance.
Overview
Go to Learnomy > Dashboard to reach this page. The dashboard is built from a registry of widgets. Each widget is an independent section that only renders when it has data to show, so a brand-new site with no students does not show rows of empty cards. Pro and third-party extensions can add their own widgets to the same dashboard through the learnomy_dashboard_widgets filter.
The page header shows a View Frontend button in the top-right corner. Clicking it opens your public course catalog in a new tab.
Stats row
The stats row is the first section below the header. It shows the four numbers that matter most to a site owner.
The four stat tiles are:
- Students -- total number of registered student accounts.
- Courses -- total published courses.
- Revenue -- total completed transaction revenue in your configured currency.
- Certificates -- total certificates issued to students.
Each tile shows the current total. These numbers reflect live counts from the database -- they update on every page load.
Onboarding checklist
On a fresh install, before the dashboard has real data, an onboarding checklist appears above the stats row. It tracks the essential first steps: creating a course, adding a lesson, enrolling a test student, and connecting a payment method. As you complete each step the checklist marks it done and eventually dismisses itself. You can also dismiss the checklist manually by clicking the dismiss link at the bottom of the section.
Demo data alert
If the site is running demo content loaded by the setup wizard, a yellow alert banner appears near the top of the dashboard reminding you that the data is not real. The banner includes a link to reset or remove the demo content.
Trends chart
The trends section shows two charts in a two-column grid: New Enrollments and Revenue over a selectable time period.
You can switch the period between the last 7 days, 30 days, and 90 days using the selector above the charts. Both charts update together when you change the period. The charts are rendered using ApexCharts and respect the site's light/dark mode.
If there are no enrollments or transactions in the selected period, the chart renders a flat baseline rather than disappearing entirely.
Completion rates and top courses
Below the trend charts is a two-column section that shows completion rates and your top-performing courses.
The Top Courses panel ranks courses by enrollment count. Each row shows the course title, enrollment total, and a completion rate percentage. Courses with zero enrollments do not appear. This panel shows up to five courses; visit Learnomy > Courses for the full list.
Recent activity
The recent activity section shows a feed of the latest events: new enrollments, completed lessons, issued certificates, new reviews, and submitted instructor applications.
Each item in the feed shows the event type, the user's name, and a timestamp. Names link to the relevant student or course detail page. The feed shows the most recent 20 events. It does not paginate -- for a full history use the Transactions or Students pages.
Additional widgets
The dashboard includes several more operational widgets that appear when they have data:
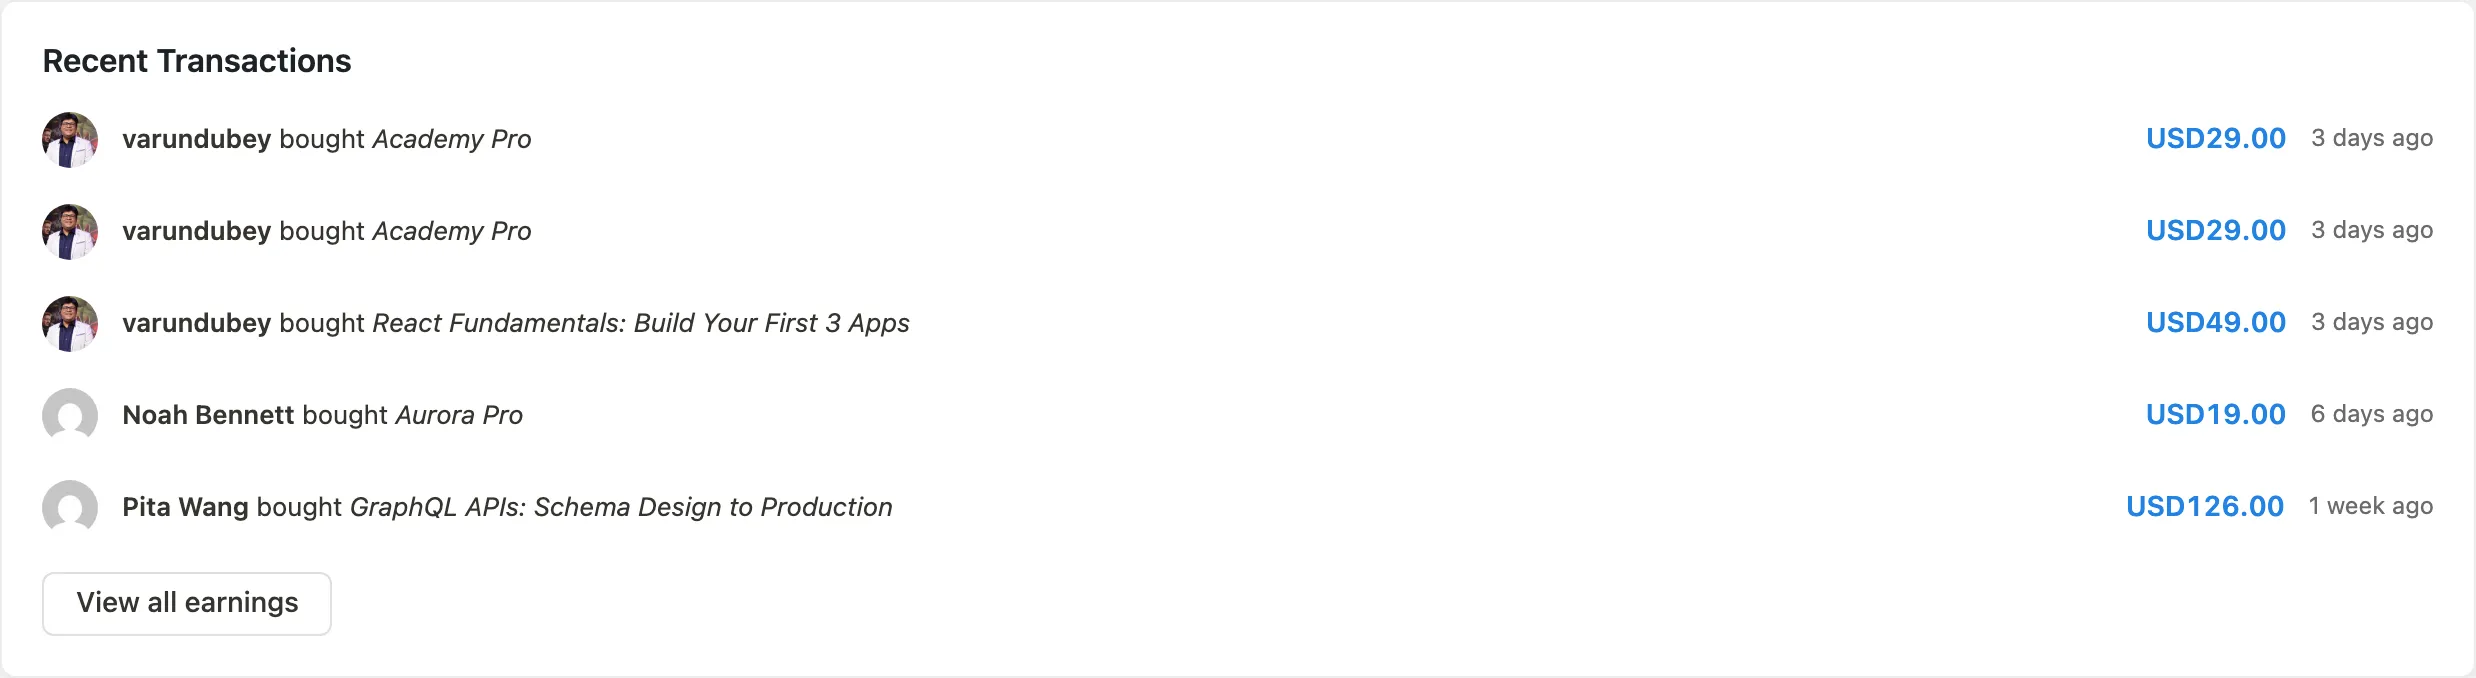
- Recent Transactions -- the last few completed payments with amount and course name. Only appears when at least one completed transaction exists.
- New Signups -- students who registered in the last 30 days.
- Top Instructors -- instructors ranked by commission earnings. Only appears when commission data exists.
- Refund Overview -- refund count and total in the last 30 days. Hidden when there are zero refunds in the period.
- System Health -- a quick check on database version, PHP version, and whether required pages (catalog, account, membership) are set. A green row means no action needed; a red row links to the relevant settings page to fix the issue.
- Email Log Summary -- count of notification emails sent in the last seven days, with a link to the full Email Log. Only appears when at least one email was sent in the period.
- Pending Applications -- instructor applications waiting for admin review, with Approve/Reject buttons inline. Only appears when there are pending applications.
- Pending Reviews -- course reviews waiting for moderation. Only appears when reviews are pending.
Pro extensions can add their own widgets to this dashboard. For example, Learnomy Pro Analytics adds an MRR (monthly recurring revenue) tile and a churn chart.
Tips
- The dashboard renders stat counts directly from the database. There is no cache to clear -- what you see reflects the current state.
- Widgets that have no data simply do not render. A blank-looking dashboard usually means the site is new and has no students or enrollments yet. Install the demo data from the setup wizard to populate it with example content.
- The View Frontend button in the page header is a quick way to verify that your front-end course catalog is live and loading correctly.