
Instructor Reports
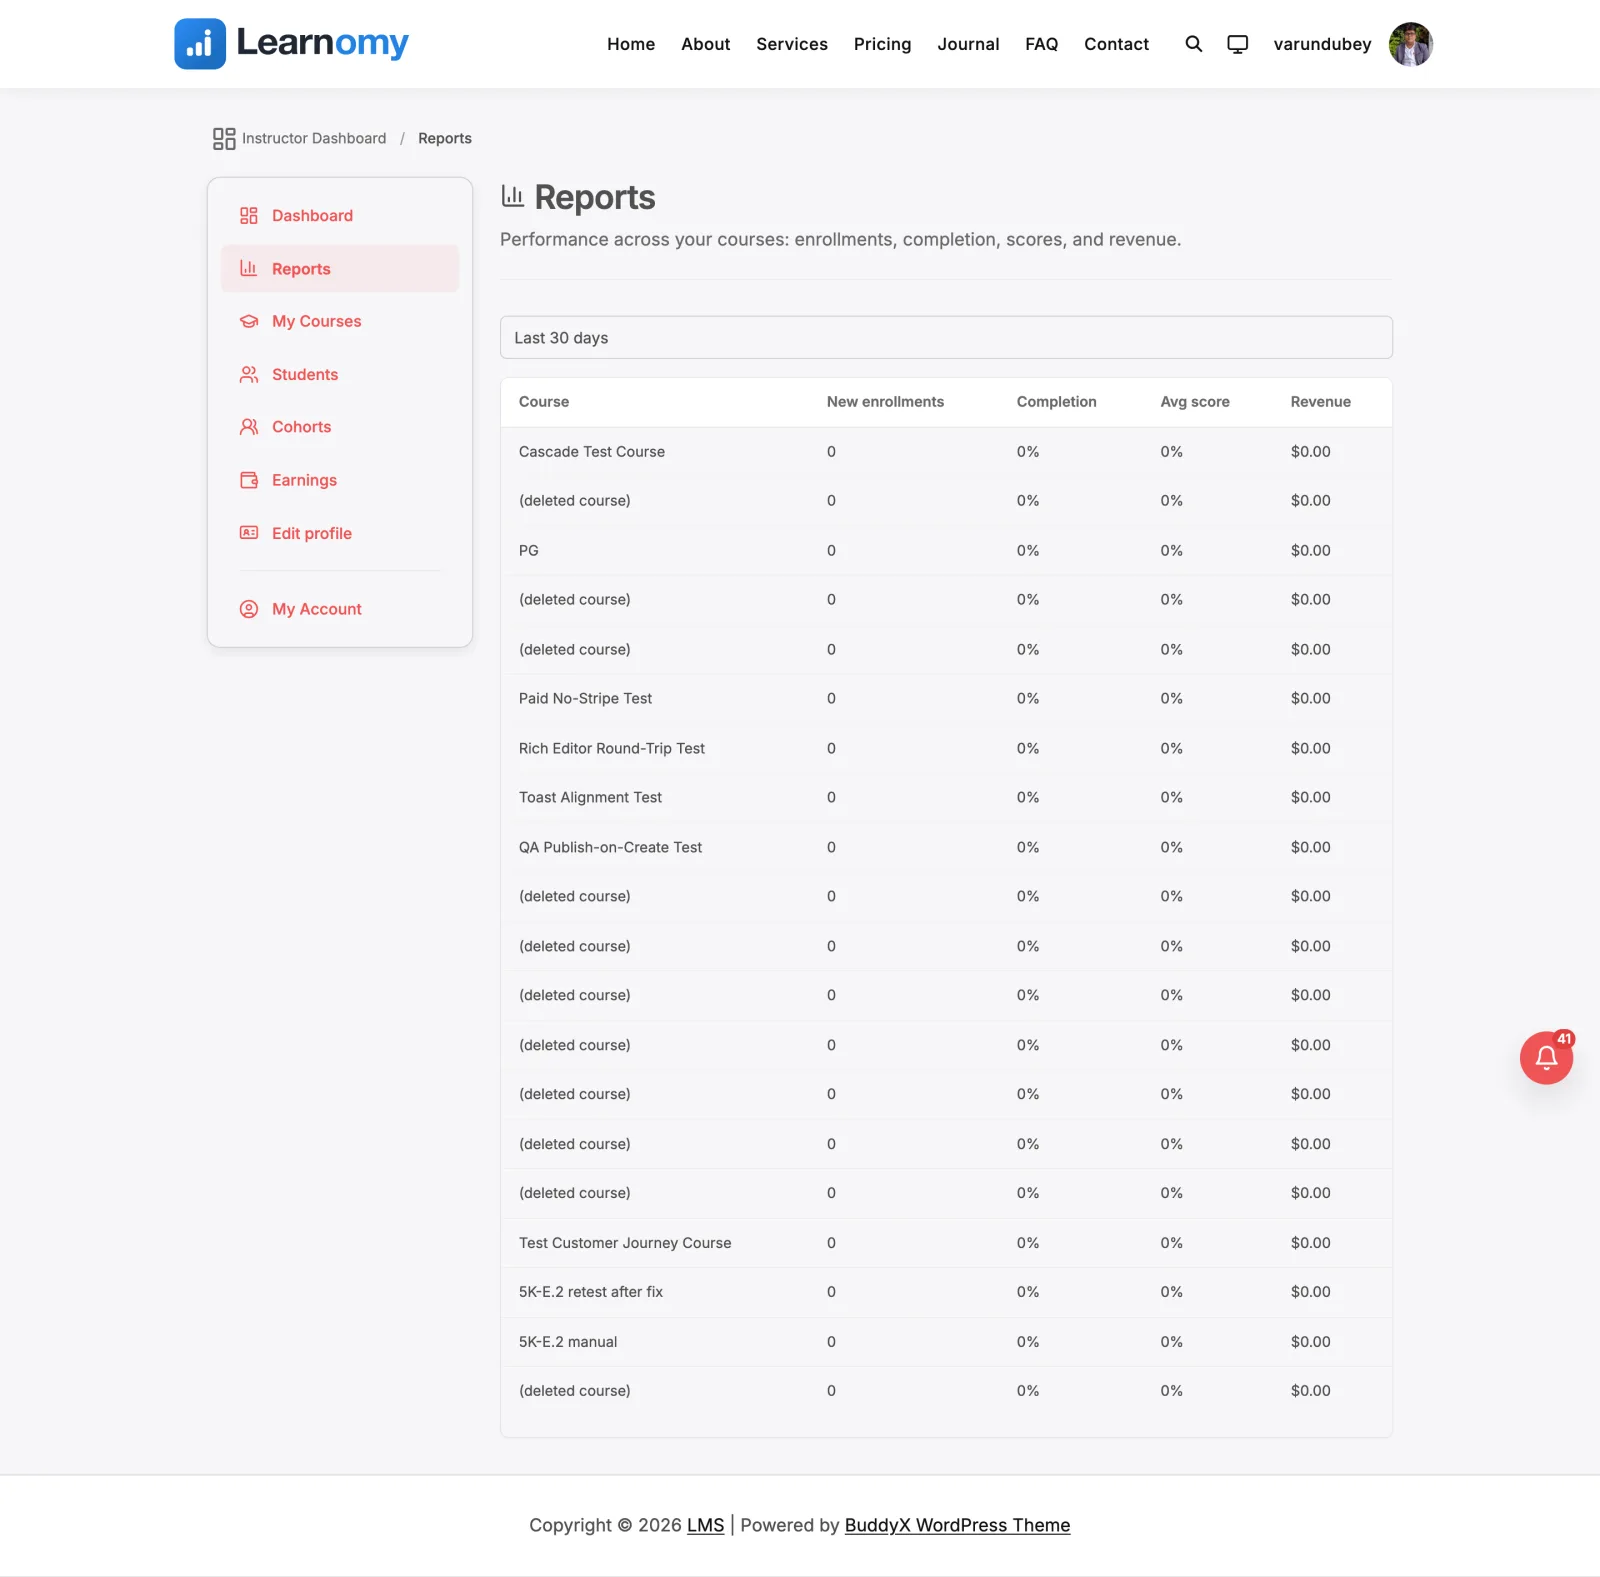
Pro featureInstructor Reports gives each instructor a front-end page at /instructor/reports/ showing how their own courses are performing -- enrollments, completion, average score, and where learners stop -- over a period they choose. Click a course to go deeper: its lesson drop-off, its roster, its assignments, and how each quiz in it is performing.
What you can do
- See per-course performance for the courses you teach: new enrollments, completion rate, average quiz score, and the lesson where most learners stop.
- Switch the reporting window between the last 7 days, 30 days, 90 days, 12 months, and all time.
- Click a course to drill in: its lesson-by-lesson drop-off, its roster, its assignments, and how each of its quizzes is performing.
- Find the hardest question in any of your quizzes, then see which answer learners are choosing instead of the right one.
- Read the numbers from your own instructor dashboard on the front end, without needing wp-admin access.
- Trust that the scope is your courses only -- an instructor sees their own courses and nothing else, and a course id typed into the address bar that is not yours is refused rather than returned empty.
- Page through a large course list without the report slowing down, because metrics are computed only for the page you are viewing.
How to use it
Step 1 -- open your reports
Sign in as an instructor and go to /instructor/reports/, or open Reports from your instructor dashboard navigation. The page sits in the same teaching shell as the rest of your instructor pages.
Step 2 -- pick a period
Use the period selector to choose Last 7 days, Last 30 days, Last 90 days, Last 12 months, or All time. The default is the last 30 days. Changing the period reloads the table for that window.
Two more filters appear only when they have something to offer: a learning-space filter on sites using Spaces, and a cohort filter once you have opened a single course. A filter that could not return a row is not rendered at all, so an empty dropdown never sits there looking broken.
Step 3 -- read the table
Each row is one of your courses, with five columns. The course title is a link into that course's own report when the course has lessons.
- Course -- the course title.
- New enrollments -- students who enrolled during the selected period.
- Completion -- what share of everyone enrolled on that course has finished it. This is a property of the course, not of the period, so it does not change when you switch the date range. See the note below.
- Avg score -- average quiz score for the period, as a percentage.
- Biggest drop -- the lesson where most learners stop, with how many.
Completion changed in 1.9.1, and your figures will move. It used to count only learners who enrolled inside the selected period, which meant someone who enrolled two months ago and finished last week was invisible to it. Because a course usually takes longer to finish than the window is wide, that made Completion read 0% on almost every course. It now counts everyone enrolled on the course against everyone who has completed it, so a course that read 0% may now show its real rate. The new number is the correct one.
Revenue is not in this table. It moved to Instructor Earnings, which answers money properly: per course, per period, with payout state. Reports answers teaching performance, which is what the rest of these columns are for.
Step 4 -- page through your courses
If you teach more courses than fit on one page, use the pagination below the table. Each page shows up to 20 courses.
Step 5 -- open one course
Click a course title to open its own report. That page answers where learners stop, who they are, and how your coursework is landing, in four sections:
- Where learners stop -- one row per lesson, in the order learners walk the course: how many reached it, how many finished it, how many left there, and the average time spent. The steepest fall is marked so you do not have to scan for it.
- Students -- the roster, 20 per page, with each learner's progress, lessons done, furthest lesson, and last activity. Click a name to open that one learner's lesson-by-lesson position.
- Assignments -- submissions, how many are graded, and the class average, when the Assignments module is on and the course has submitted work. The average shows "Not graded yet" rather than 0% until something is graded. This section has its own pager.
- Quiz performance -- described next.
Assignments and Quiz performance are hidden entirely when they have nothing to show. The lesson funnel and the Students list always render their heading; an empty roster shows "No Students on this page" rather than disappearing. If the whole page is empty, the message names the reason: no lessons yet, nobody enrolled, nobody has started, or a filter that removed everything.
Step 6 -- read Quiz performance
The Quiz performance section sits at the bottom of a course's report and lists every quiz in that course -- attached to a lesson, attached to a section, or standing alone -- including quizzes nobody has attempted yet. Four columns:
- Quiz -- the quiz title.
- Attempts -- every attempt started on that quiz, whatever state it is in.
- Pass rate -- the share of graded attempts that passed. While no attempt is graded it reads "No attempts yet" rather than 0%, because "nobody has been graded" is not "everybody failed".
- Hardest question -- the single question in that quiz that the fewest learners answered correctly, with that percentage beside it. This is the column the section exists for: it names the question to fix instead of leaving you to work out why a quiz is hard.
The section does not appear at all when the course has no quizzes.
Step 7 -- drill into a hard question
Click the question named in Hardest question to open its answer breakdown: how many graded responses it has, and for a multiple-choice question, every option with how many people chose it and what share of responses that is, most-chosen first. The correct answer is marked. If a wrong option was picked more often than the correct one, it is called out - that usually means a misleading distractor or a mis-keyed answer, and it is the fastest thing on this page to act on.
Open-ended questions (essay and similar) have no fixed options to tally, so they show a note instead of a table. Back to course report returns you to the course, keeping the period you were on.
Settings and options
- Who can see it -- instructors (for their own courses) and administrators. "Their own courses" means courses they author plus courses they are assigned to as an instructor. Administrators see published courses across the site so the page is meaningful for them too. Anyone else is shown an "Instructor access required" message.
- Quiz analytics access -- the per-quiz figures in the Quiz performance section were an administrator-only read before this release, which meant an instructor could not see the analytics for their own course. An instructor who owns the course now sees them. Another instructor's course is still refused.
- Period -- 7 days, 30 days, 90 days, 12 months, or all time. Any other value falls back to 30 days.
- Page size -- 20 courses per page, and 20 students or 20 assignments per page inside a course. The lesson funnel and the Quiz performance section are not paged: a course carries few of each, so both list in full.
- Empty state -- every empty screen says which of the possible causes it is, and offers the matching next step. "No students match this filter" and "no one has enrolled yet" look identical as a blank table but call for opposite actions.
For developers
View-data Learnomy_Pro\Extensions\Analytics\Instructor_Reports_View_Data:
resolve( array $data ): array-- gates access (instructor or admin), then decides which of four levels to render: the course list, one course, one learner, or one question. Scope comes from the logged-in viewer viaReport_Query::scope(), never from the request; a?course=the viewer does not own is denied rather than returned empty, because an empty table would confirm the row exists. A?question=they do not own is treated differently on purpose: it drops back to the course view rather than denying, so a stale bookmark lands somewhere useful.- Per-course metrics for the visible page come from the shared Pro reporting engine
Analytics_Aggregate:course_new_enrollments(),course_completion_rate(),course_avg_score(),course_attempt_count(), each taking the course id and the period. Course titles are batch-loaded with the freeCourse::find_in(). course_quizzes()builds the Quiz performance section in three batched reads and no per-row query: the freeQuiz::for_course()(every quiz in the course, lesson-attached, section-attached, or loose, including ones with no attempts), the freeQuizAttempt::pass_stats_for_quizzes()for attempts and pass rate (the same batch the wp-admin quiz list uses, so the two surfaces cannot disagree), andAnalytics_Aggregate::hardest_question_by_quiz()for the lowest-facility question per quiz.question_detail()backs the drill-in, overAnalytics_Aggregate::question_analysis().
The Pro REST route GET /learnomy-pro/v1/analytics/quizzes/{id} serves the same per-quiz analytics. Its check_quiz_permission() callback passes the learnomy_view_advanced_analytics capability (administrators) or an instructor whose course the quiz belongs to, resolved through Report_Query::scope() so ownership is answered exactly once. It previously required the capability alone, which is why instructors were refused their own courses' quiz analytics.
Template views/instructor-reports.php renders inside the shared .lrn-account-layout teaching shell and delegates each level to a partial in views/reports/. It reuses the free table, badge, and pagination partials -- no forked report logic and no new CSS. The route is instructor-reports (route_url('instructor-reports')), auth-gated through the free protected-routes list; list pagination uses the registry's /reports/page/N/ segment, while the assignments section carries its own apage query arg so the two pagers never fight.