Membership Analytics
Pro feature🔶 Pro feature. Available in Learnomy Pro.
Membership Analytics shows the health of your subscription business: monthly and annual recurring revenue, churn rate, subscriber flow, and cohort retention. Use it to track whether your membership is growing, shrinking, or holding steady.
Overview
The Membership Analytics dashboard is at LMS Commerce > Membership Analytics in the admin sidebar. It is only visible when the Membership Pro extension is active in Learnomy Pro.
The page has two tabs: Overview (this page) and Paused (subscribers who have paused their plan).
Opening the Dashboard
Go to LMS Commerce > Membership Analytics in the admin sidebar.
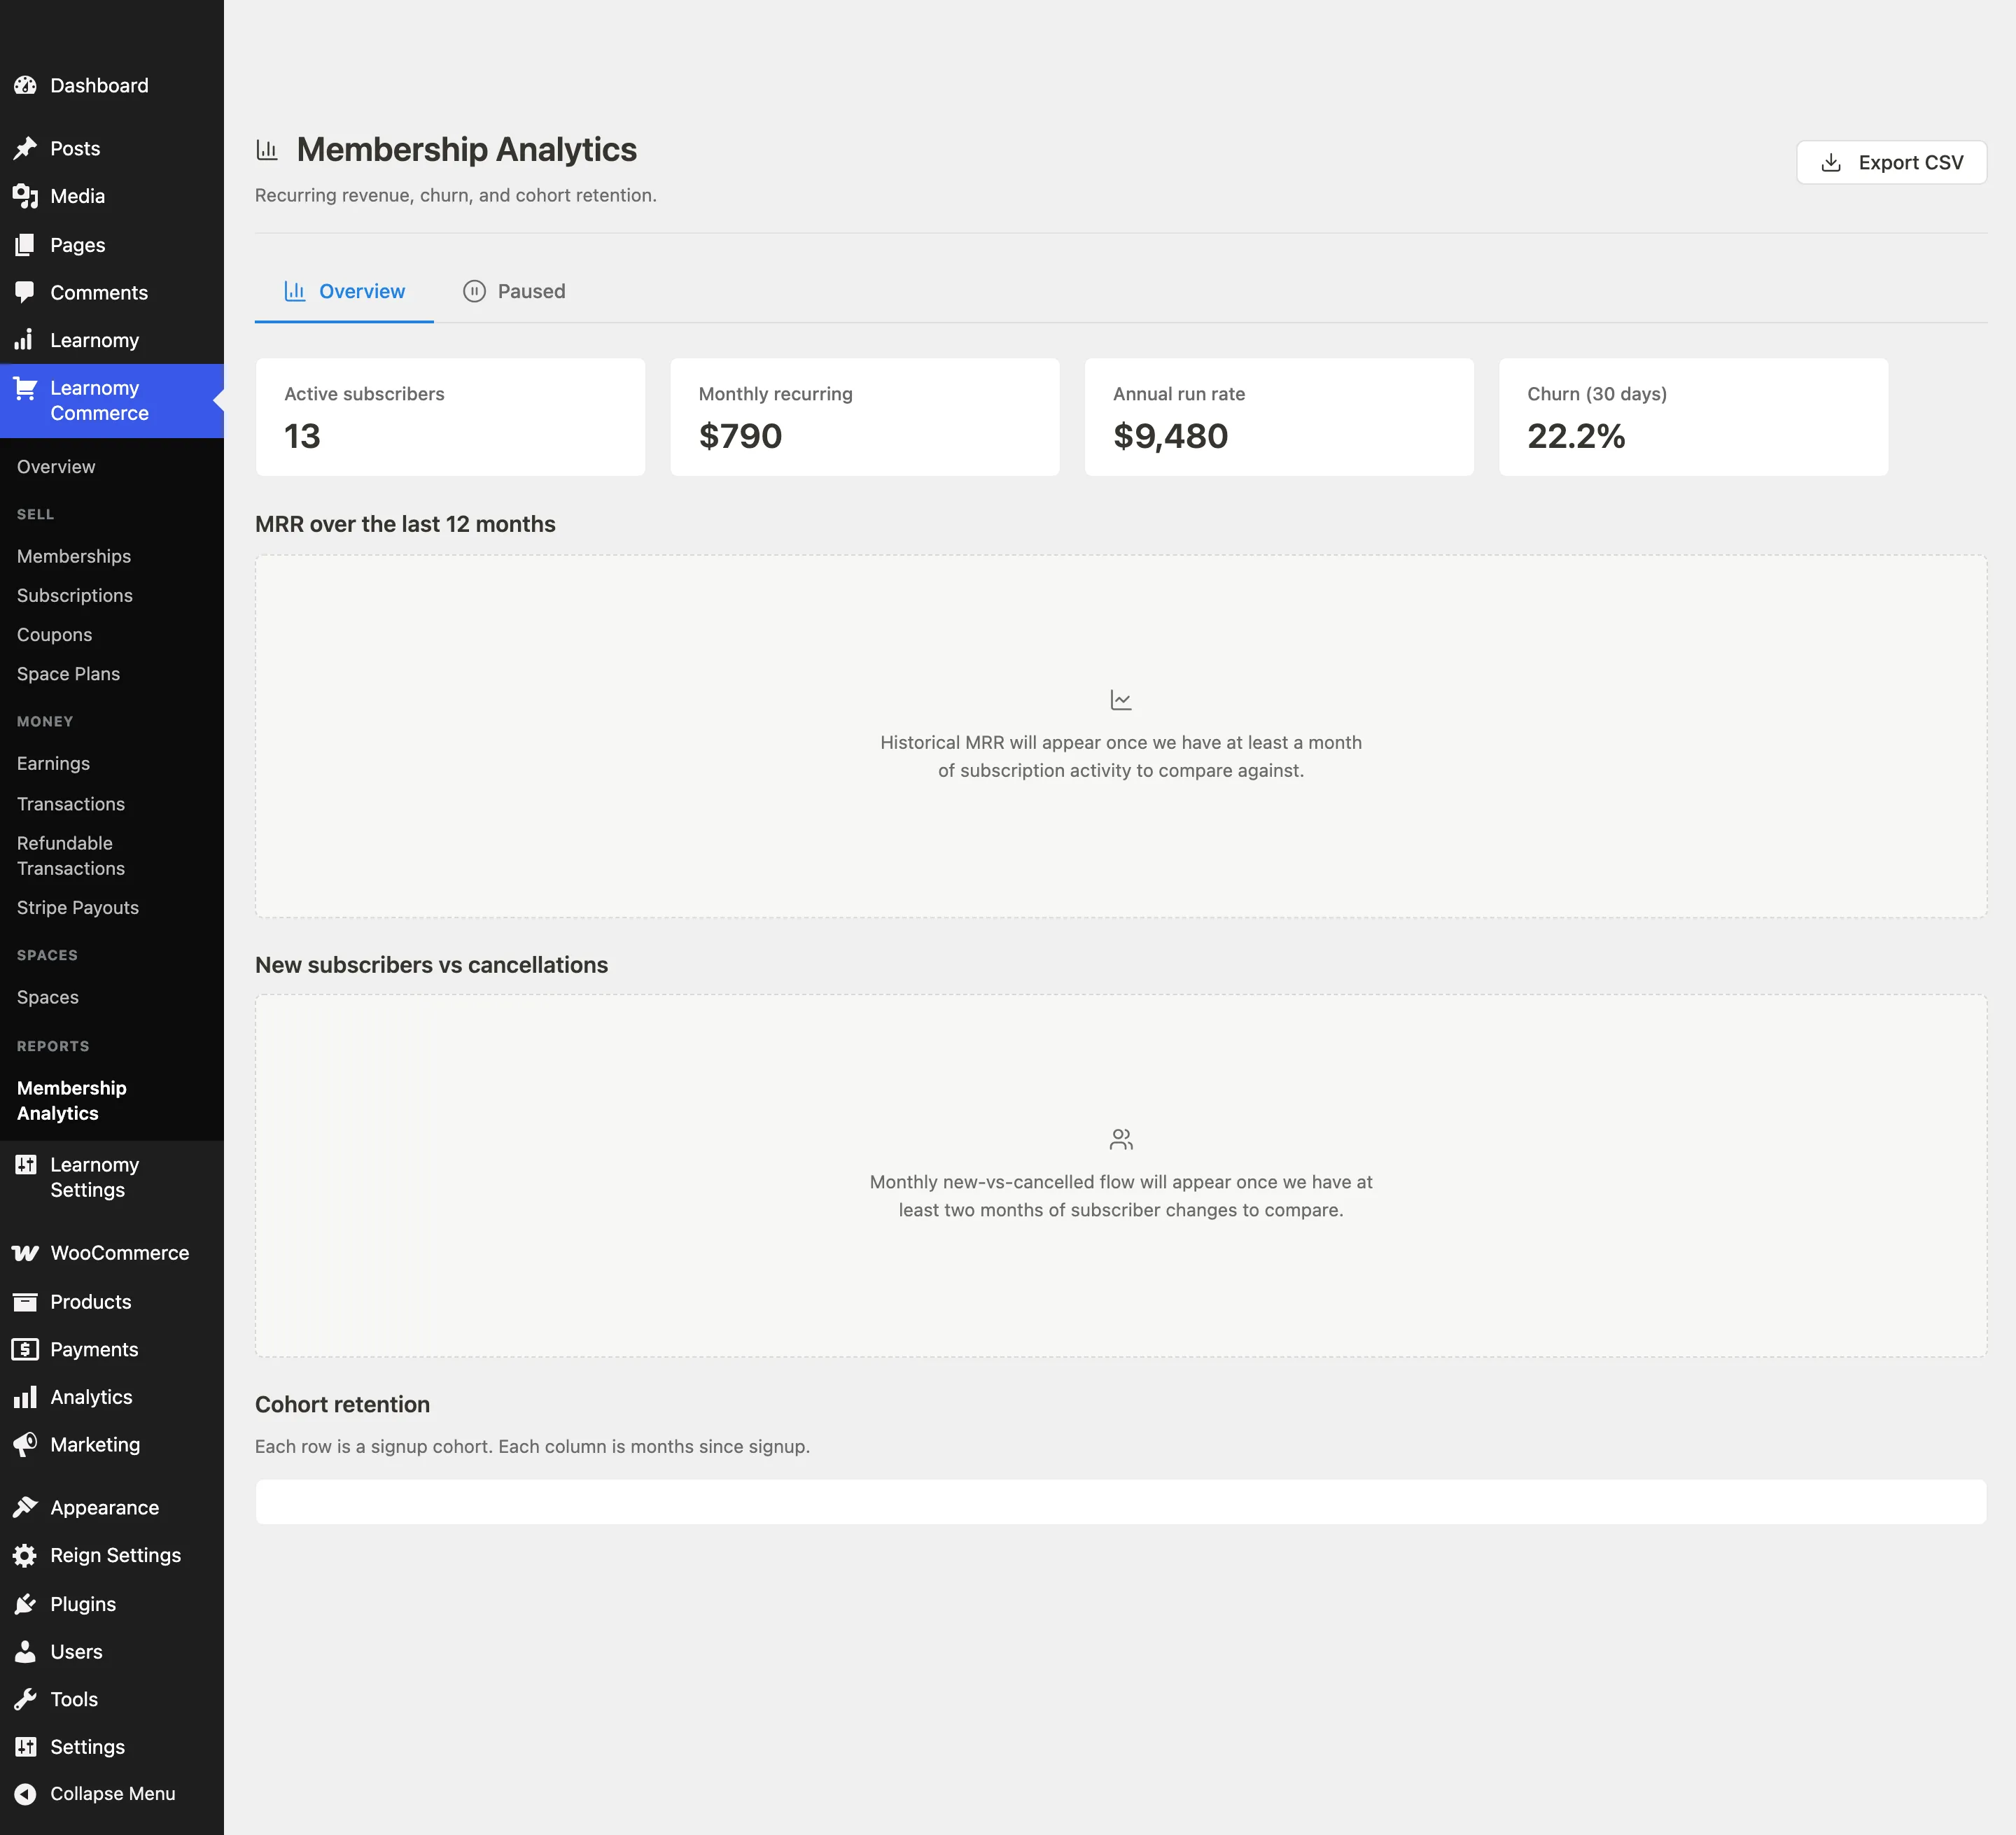
The page header shows the title and a description: "Recurring revenue, churn, and cohort retention."
The live view loads asynchronously from two REST endpoints (MRR and churn). If either endpoint fails, an error notice appears with a Try again button.
KPI Cards
The KPI section shows four headline numbers. The values update as soon as the REST calls complete.

| Card | What it shows |
|---|---|
| Active subscribers | The current number of active paid members |
| Monthly recurring | MRR: the sum of monthly subscription revenue from all active plans at their current billing amounts |
| Annual run rate | ARR: MRR multiplied by 12 |
| Churn (30 days) | The percentage of active subscribers who cancelled in the last 30 days |
If no members have subscribed yet, the KPI grid shows "No subscription data yet."
MRR over the Last 12 Months
This section shows a placeholder message in the current release. Historical MRR trend charting requires a data-history layer that is not yet shipped. The placeholder reads: "Historical MRR will appear once we have at least a month of subscription activity to compare against."

New Subscribers vs Cancellations
This section shows a placeholder message in the current release. Monthly new-versus-cancelled flow charting requires the same historical-data layer. The placeholder reads: "Monthly new-vs-cancelled flow will appear once we have at least two months of subscriber changes to compare."

Cohort Retention
Cohort retention and lifetime-value (LTV) data currently surface through the CSV export (see Exporting Data below). The on-screen cohort-retention grid is limited in this release: the live page fetches MRR and churn only, so the grid is not fully populated. Use the CSV export for cohort and LTV analysis.

In the export, each cohort is a month in which subscribers joined. Each column is the number of months since that cohort signed up. The value in each cell is the percentage of the original cohort still active at that point.
Read it like this: a value of 80 in the "Month 3" column for the February cohort means 80% of subscribers who joined in February were still active after three months.
Exporting Data
Click Export CSV in the page header to download the current membership analytics data. The export uses the same data that populates the KPI cards and is useful for reporting outside Learnomy.
Tips
- MRR is a point-in-time calculation based on active subscriptions and their billing amounts right now. It does not include paused subscriptions.
- Churn is calculated over the last 30 days regardless of any period filter. There is no period selector on this page.
- The Paused tab lists subscribers who have temporarily paused their plan. Paused subscriptions are not counted in Active subscribers or MRR.
- Cohort retention requires at least two months of data before the second column populates. A new site will see mostly empty cells until subscribers have been active for a few months.